GitHub: @quantum9innovation Go to profile

Source: code For this page

See also: CoronaSurveys See project and Team 1280 See GitHub

You can keep reading Next section or go to my blog The Axiom .


Projects

These are some of the projects I've worked on, many of which are are available on GitHub See repos as open-source projects. On GitHub, I'm a member of the core epispot @epispot team, which models infectious diseases with mathematical models, and the Team 1280 @Team-1280 organization.

Proto

GitHub
Technical overview
Manual

Proto is a universal, open-source toolset for learning new languages. It contains numerous tools for studying languages effectively and is completely open-source. It uses a custom spaced-repetition algorithm to prioritize vocabulary recall and integrates user-defined grammar properties into vocabulary flashcards. As almost any part of the application can be highly customized, Proto can easily be used to study a wide variety of different languages without any formal course framework.
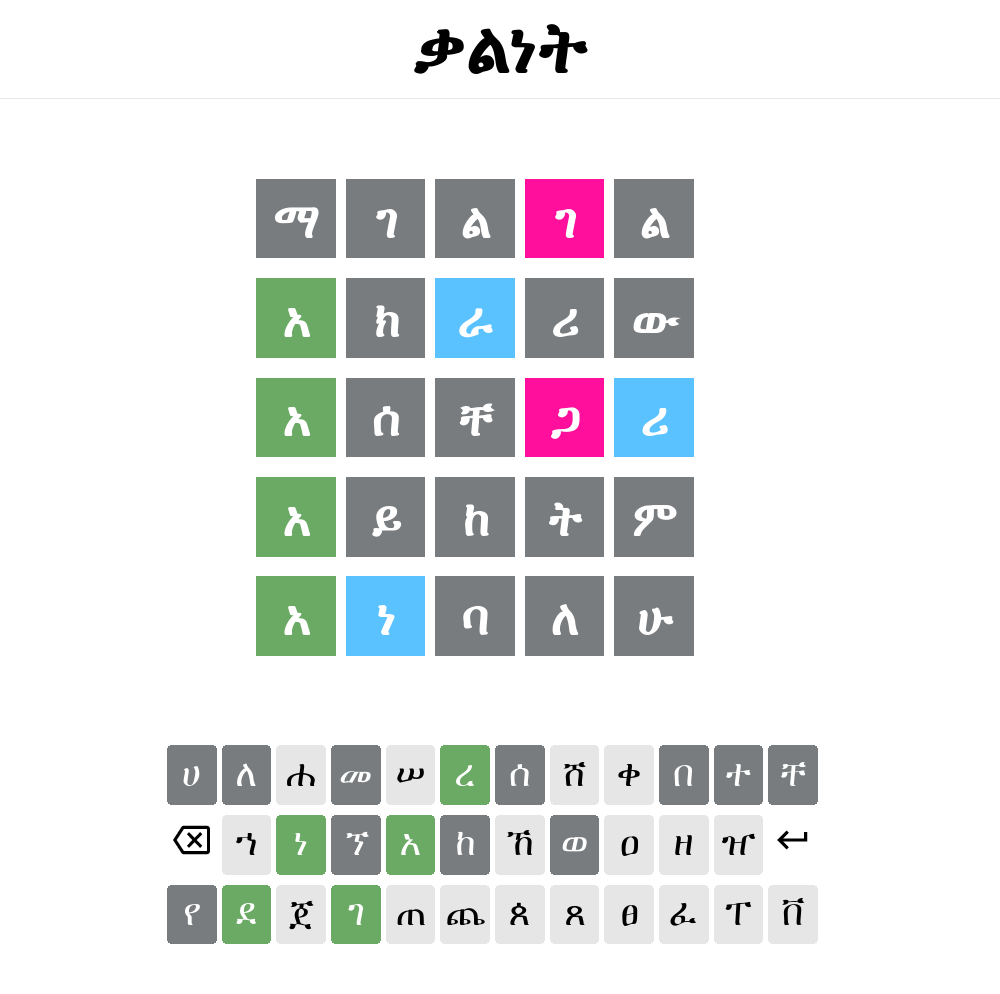
Amharic Wordle

GitHub
Website
Instructions (in English)

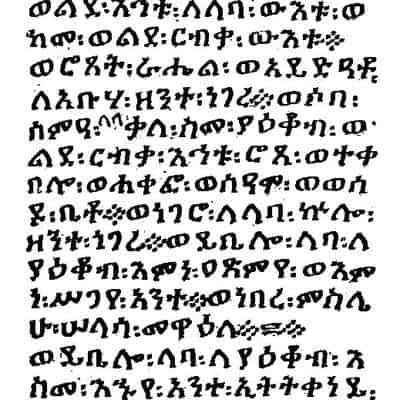
This is a version of Wordle in Amharic (also known as እንቆቅልሽ). Each day, a new five-letter Amharic word is chosen from a pool of common words, gathered by scraping words from the internet and categorizing them by frequency. You can play in over four different game modes and in varying levels of difficulty. The game is a great way to learn both the Ge'ez script and Amharic orthography.

Sost

GitHub
Interactive demo

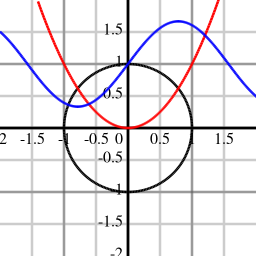
Sost (ሶስት) is a 3D graphics library for the web. It uses the standard HTML canvas element to render 3D objects. It currently supports zoom and perspective control via linear algebra-based transformations. It is intended to be used as a graphing calculator (the three-dimensional counterpart to Hulet Scroll ) for interactive mathematical explainers on my blog The Axiom .

Hulet

GitHub
Interactive demo

Hulet (ሁለት) is a programmatic graphing calculator for the web. It uses the standard HTML canvas element to render 2D objects and can apply matrix-based transformations. I frequently use it in my blog The Axiom for interactive mathematical explainers. Aside from graphing mathematical functions, Hulet also provides an alternative 2D graphics interface for web animations and has been used in numerous other applications, including physics engines and simulators Scroll .

Tolo-Tolo

GitHub
Website

Tolo-tolo (ቶሎ ቶሎ) is a set of tools designed to help Amharic learners with basic grammar, like verb conjugation and noun modifiers. It uses an algorithm to generate a set of challenges which test various grammar concepts. These exercises can accelerate the early learning process and are designed to match the Foreign Service Institute's See FSI courses Basic Amharic Course.

Zing

GitHub

Zing is a very simple teleprompter that automatically splits up long texts into short fragments that are easier to read. It features an intuitive user interface with adjustable speed so it automatically tracks your reading progress. It is particularly helpful for rehearsing long speeches with time constraints or to use in moderated discussions.

NYT Word Games

GitHub
Website

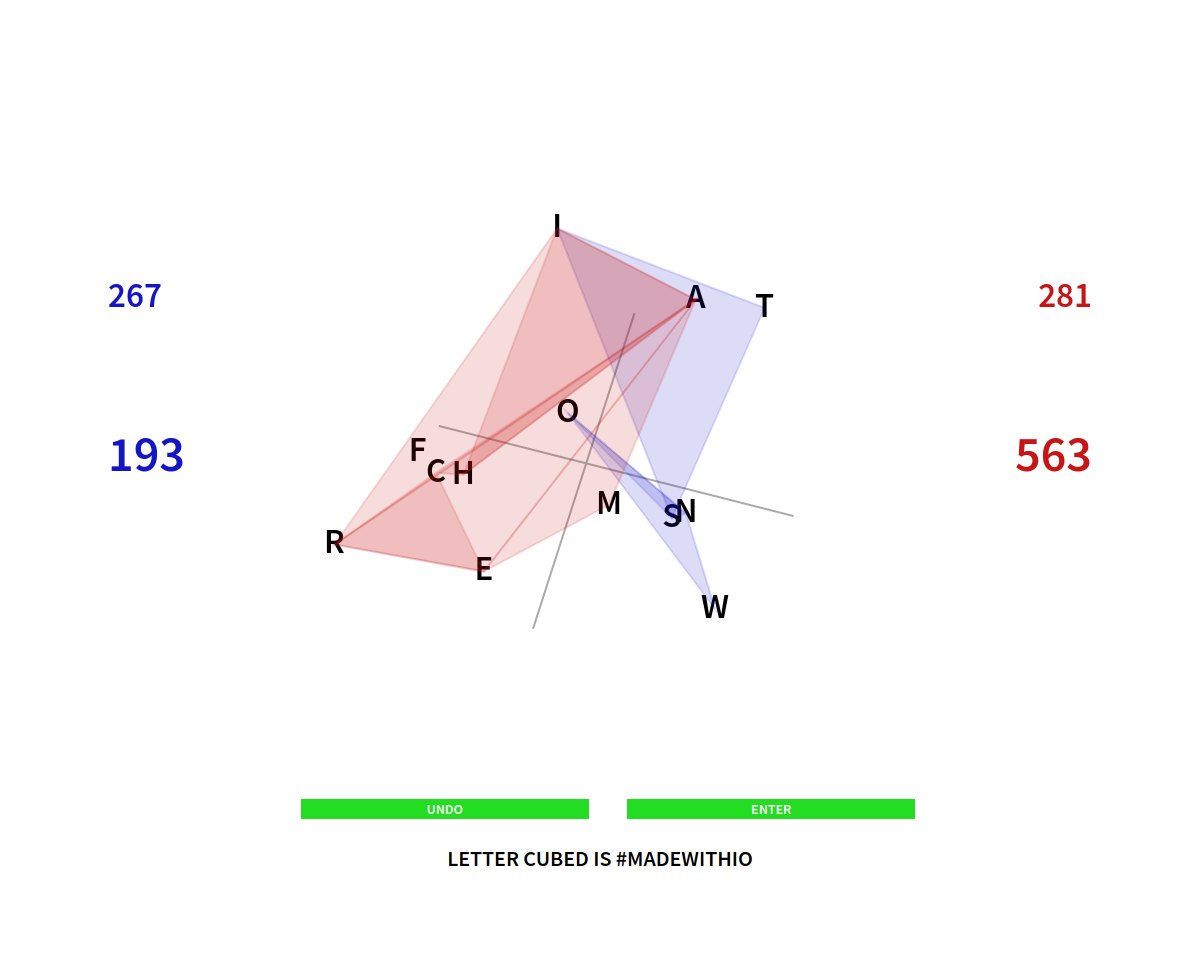
This is an attempt to recreate many of the popular New York Times word games and re-release them under permissive open-source licenses. It currently contains an English version of "Letter Boxed," which is a 3D variant of the original game See on NYT . All the recreated games are free to play without any subscription.


Open Source Contributions

The following are some of the projects I've contributed to on GitHub. They include those in the @epispot See GitHub and @Team-1280 See GitHub GitHub organizations, as well as some other community projects.

epispot/epispot

Epispot is a Python package for the mathematical modeling of infectious diseases via compartmental models. Epispot can be adapted for almost any type of modeling scenario and can be easily configured to run local analyses of specific diseases. It has been used in various related projects to analyze and predict the spread of the COVID-19 virus.

epispot/covid-notebook

This is an interactive notebook for examining trends in COVID-19 cases, which won third place in the 2022 Congressional App Challenge. See the announcement It gathers local data from various sources and generates predictions of the future spread of COVID-19 at the local level. It includes data from every county in the United States and some districts in Puerto Rico and other US territories.

Team-1280/Driving-Simulator

This is a driving simulator for non-holonomic drivetrains (driving mechanisms that are not omnidirectional) used in the FIRST Robotics Competition What is this? . It simulates the kinematics of the drivetrain and allows previewing various control strategies before teams fully assemble a drivebase to test on. You can preview one of the simulations in this demonstration Go to site .


Research

The following are some of the main research projects I've worked on and a preview of some of their results. Most center around my work on the CoronaSurveys Project See site , an international initiative See GitHub to track COVID-19 via indirect surveys.

Processing COVID-19 survey data

The CoronaSurveys project utilized thousands of daily regional surveys to generate national estimates. I developed various scripts (e.g. generating national data from regional estimates See GitHub source ) that process data from various geographical areas and merge them based on populations, responses received, and other variables. The results can be seen in the main CoronaSurveys dataset See graphs , which is generated daily using these scripts.

Mapping the spread of COVID-19

I created various international maps of the spread of COVID-19 at both the regional and national level. This repository See GitHub contains scripts for fetching the latest data from the CoronaSurveys dataset and displaying it in various formats using Plotly. It will automatically use the most recent survey responses for each region and thereby provides an accessible way to track COVID-19 hotspots using independent measurements of its spread ( not provided by official figures See whitepaper ).

Corroborating CoronaSurveys data

To corroborate the results of the CoronaSurveys project, which independently tracked COVID-19 without relying on official figures, I used data from the Office of National Statistics See datasets , which tracked COVID-19 in the UK using a similar survey-based technique, and matched the predicted number of infected individuals with the data from the CoronaSurveys project over the same time period. I found general correlations between the two datasets, though work is still ongoing to confirm these correlations in other datasets (particularly in areas outside the UK).